Extreme weather prediction across Singapore, using a ConvLSTM2D model.
This page is a brief overview of our research on extreme weather prediction using a ConvLSTM2D model. For more details, please refer to our documentation or try out our app!
Background
CNN-LSTM
For the task of weather prediction using machine learning, the CNN-LSTM model is typically used. A CNN-LSTM model utilizes a convolutional layer to learn spatial features, which are then passed to an LSTM layer to capture temporal dependencies. The final fully connected layer processes the LSTM layer’s output to minimize variability and improve predictions (Sainath et al., 2015). However, the LSTM layer linearizes its input to the fully connected layer into a 1-dimensional array (Hu et al., 2020), leading to a loss of spatial considerations while retaining only the temporal ones (Shi et al., 2015); (Hu et al., 2020).
ConvLSTM2D
In contrast, ConvLSTM2D performs convolutional operations within the LSTM cell, allowing for a 3-dimensional input incorporating spatial and temporal dimensions (Hu et al., 2020). This results in the retention of both spatial and temporal features, thus enhancing the learning of correlations within the data (Shi et al., 2015); (Gaur et al., 2020).
 Inner Structure of ConvLSTM2D (Shi et al., 2015)
Data Source
This research utilizes the downscaled dataset as discussed in the our Climate Downscaling research. The data was bias-corrected, downscaled, and refined from Global Climate Models (GCMs) to minimize the biases and improve the accuracy of the data.
Results
Precipitation
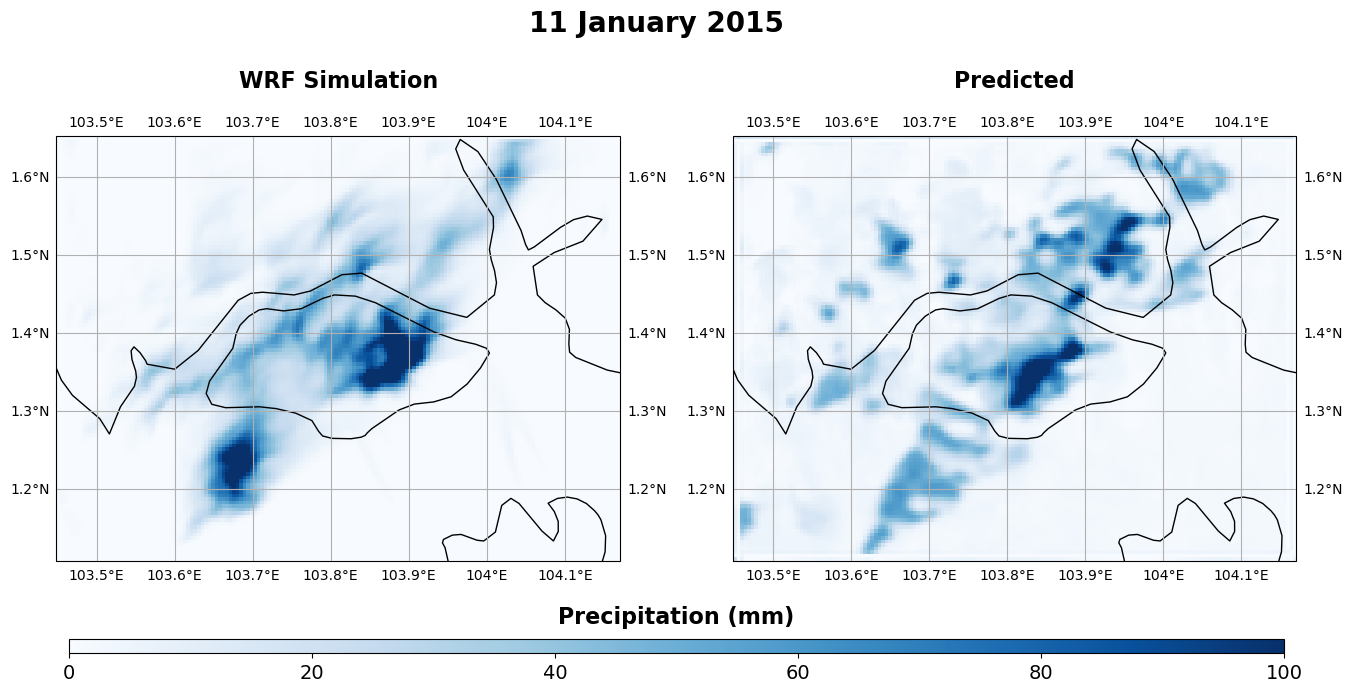
 WRF Simulated vs Predicted Precipitation
The model tends to overpredict the intensity of precipitation, yet it accurately captures areas experiencing intense precipitation. This overestimation could be primarily due to the loss function employed in the model, which heavily weighs the Mean Squared Error (MSE) component, thereby significantly penalizing the incorrect predictions of extreme values.
Predicting the location of intense precipitation accurately is important, particularly for flood forecasting. The predicted precipitation values can help assess the potential for flooding and evaluate the effectiveness of the local drainage networks. However, the overprediction of precipitation may pose challenges when computing the SPI values.
Standardized Precipitation Index
Our research focuses on the prediction of extreme weather events, such as droughts and floods. To achieve this, we use the SPI as a metric to quantify the severity of droughts and floods. The SPI is a widely used drought index that is used to quantify the severity of droughts and floods. It is a measure of the number of standard deviations by which the precipitation deviates from the long-term mean precipitation. The following table summarizes the SPI values and their corresponding drought and flood categories.
| SPI Value | Classification |
|---|---|
| ≥ 2.00 | Extremely Wet |
| 1.50 - 1.99 | Severely Wet |
| 1.00 - 1.49 | Moderately Wet |
| -0.99 - 0.99 | Near Normal |
| -1.00 - -1.49 | Moderately Dry |
| -1.50 - -1.99 | Severely Dry |
| ≤ -2.00 | Extremely Dry |
For our research, we employ the 1-month SPI to quantify the severity of droughts and floods. The SPI values are computed for each grid cell in the study area. The SPI values are computed for the WRF simulated precipitation and our predicted precipitation. The SPI values are computed for each grid cell in the study area. The SPI values are computed for the observed precipitation and the predicted precipitation.
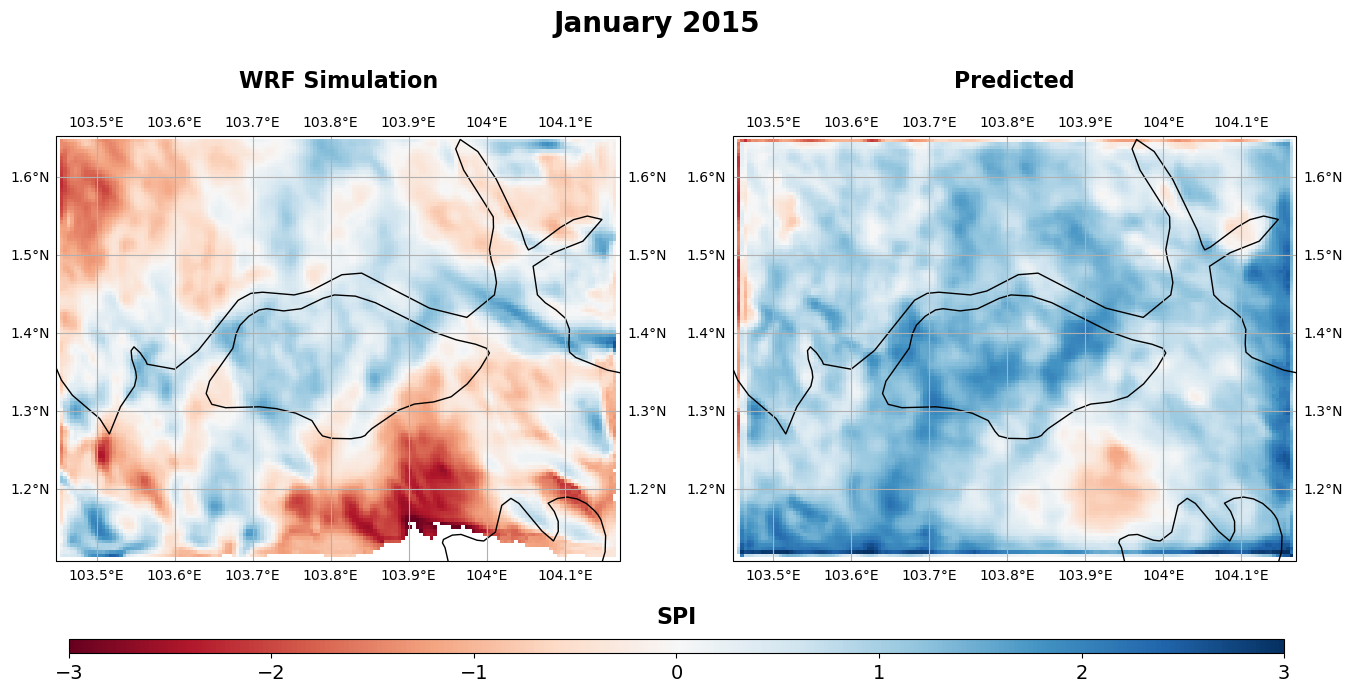
 WRF Simulated vs Predicted SPI
The SPI of the predicted values overestimates flood intensity and underestimates drought intensity, likely due to the ConvLSTM2D model’s overprediction of precipitation across all grids and timesteps. Since our model tends to overpredict the intensity of precipitation, the higher predicted mean precipitation results in higher SPI values.
Since this page serves only as a brief overview of our research, the analysis of the predictions will be discussed in the Analysis section of our documentation.
Additionally, the web app offers more features, such as the ability to compare and analyze the predictions of the model with the WRF simulated data for any given waterbodies across Singapore! The web app also allows the user to select their timestep of interest and compare the predicted results with the WRF simulated data, which serves as our “true” data for comparison. Try out the web app and explore the results for yourself here!


